


INTRODUCTION
Gastric cancer (GC) is the most common cancer and the third leading cause of cancer death worldwide [1]. The U.S. Food and Drug Administration (FDA) approved pembrolizumab, an antibody against programmed cell death protein 1 (PD-1), to treat patients with advanced solid tumors bearing the microsatellite unstable (MSI)/DNA mismatch repair (dMMR)-deficient biomarker [2]. A recent nonrandomized, multicenter, multicohort basket trial of pembrolizumab in 475 patients with one of 20 different programmed death ligand 1 (PD-L1)-positive advanced solid tumors showed diverse objective response rates (ORRs) across different cancer types. Biomarkers that can predict response to anti-PD-1 therapy across multiple tumor types include T-cell inflamed gene expression profile (GEP), PD-L1 expression, and/ortumor mutational burden (TMB) [3]. However, larger studies are needed to obtain more precision within individual cancer types and to assess the potential clinical utility of developing cutoffs for such biomarkers in patient selection for anti-PD-1 therapy [3].
In GC, a single-arm, multicohort, pembrolizumab phase 2 trial (KEYNOTE-059) showed an ORR of 11.6%, and 2.3% ofthe patients showed complete responses (CRs), with a lower proportion of responders among patients with GC compared to patients with non-small cell lung cancer [4]. The high proportion of non-responders and the emergence ofresistance in patients who do initially respond pose significant challenges in the field of cancer immunotherapy [5]. A recent molecular characterization study of metastatic GC patients treated with pembrolizumab showed that MSI, Epstein-Barr virus (EBV)-positivity, PD-L1 combined positive score (CPS) positivity, TMB, and decrease in circulating tumor DNA levels at 6 weeks post-treatment were associated with response to treatment [6]. Although T-cell inflamed GEP has been shown to predict the clinical efficacy of pembrolizumab therapy across a set of 20 diverse solid tumors and has provided biomarkers that are potentially relevant for selection of patients who may benefit from PD-1 inhibition, it did not predict responses in patients with metastatic GC. Chronically inflamed mucosa in ulcerated cancertissue or mesenchymal phenotype linked to decreased tumor susceptibility to immune effector cells [5] would contribute to the underlying mechanism for the lack of response to immune checkpoint blockade (ICB).
Predictive biomarkers for immunotherapy differ from the traditional biomarkers used for targeted therapies because of the complexity of the immune response and tumor biology. Recently, immuno-predictive score, IMPRES, based on 45 immune checkpoint genes was developed to predict responses to ICB in patients with melanoma [7]. Given the differences in tumor biology and need for clinical-grade biomarkers to guide the choice of agent to maximize the likelihood of patient benefit, we developed a GC-specific gene expression setto predictresponse to pembrolizumab.
METHODS
Patient selection
From 2013 to 2017, 61 patients with mGC were enrolled for prospective single-site, phase 2 clinical trial to assess clinical responses to pembrolizumab [6]. The trial protocol was approved by the Institutional Review Board of Samsung Medical Center (Seoul, Korea) (2015-09-053) of Samsung Medical Center (Seoul, Korea) and all patients provided written informed consent. Among them, 21 cases were selected forthe present study based on availability of primary tumor tissue and clinical responses to pembrolizumab. Their median age was 57 years (range, 26 to 78 years), and they included four patients (19.1%) with MSI GC and two patients (9.5%) with EBV-positive GC. Clinical data, including demographic features and treatment outcomes, were obtained by reviewing medical records. The precise characteristics of the patients with responses to pembrolizumab are described in Table 1.
RNA extraction
For isolation of total RNA from formalin-fixed paraffin-embedded tissue, 10 (4-μm-thick) sections were cut from each tissue block. RNA was isolated using the RNeasy FFPE kit (Qiagen, Hilden, Germany) according to the manufacturer’s instructions. The preparations were deparaffinized and subjected to proteinase K treatment, on-column DNase digestion, and elution using RNase-free water as described in the manufacturer’s protocol. Total RNA samples were stored at –80°C until use. RNA concentrations were measured using NanoDrop (Thermo Fisher Scientific, Waltham, MA, USA).
Gene expression profiling using a NanoString assay
For gene expression profiling, a NanoString assay (NanoString Technologies Inc., Seattle, WA, USA) was performed with GC tissue sample RNA. For this experiment, we made probes containing 168 genes related to mesenchymal signature [8] and host immune response genes identified by comprehensive analyses of tumor immunity [9]. For control, 11 housekeeping genes and 14 technical internal control genes were also added. We performed the NanoString assays following the standard protocol ‘Setting up 12 nCounter Assays (MAN-C0003-03, 2008-2013).’ Hybridization reactions were incubated for 18 hours. Data analysis was performed using the nSolver software available from NanoString Technologies. Data were normalized using housekeeping genes and internal controls and were transformed into a log10 scale in nSolver software (version 4.0).
Differentially expressed gene analysis for response to pembrolizumab
For development of a gene signature that predicts response to pembrolizumab, differentially expressed gene (DEG) analysis was performed using nSolver software. To identify DEG by comparing the pembrolizumab response group and no response group, a P<0.01 was chosen as a cutoff value.
Development of a prediction model for response to pembrolizumab and validation in The Cancer Genome Atlas and Asian Cancer Research Group cohorts
To construct a prediction model, the mRNA expression levels of genes with significantly different expression patterns and the PD-L1 CPS of the GC tissues were analyzed using a linear regression model. The prediction model was evaluated by calculating sensitivity and specificity with the area under the curve (AUC). The cutoff values for dividing patients with mGC into the response and no response groups were also defined by the accuracy function in the AUC package. To evaluate our prediction model, cross validation was performed 10 times, and the root mean squared error (RMSE) for each validation was calculated. As MSI and EBV-positivity and TMB are closely related to responses to immunotherapy, we validated our results from RNA sequencing data of The Cancer Genome Atlas (TCGA) and microarray data of Asian Cancer Research Group (ACRG) (Supplementary Fig. 1). The ComBat function was used for adjusting gene expression data using the sva package, because the validation data and test data had different platforms. All statistical analyses and all visualized plots were performed in R program version 3.4.4 (R Foundation for Statistical Computing, Vienna, Austria). The total mutation rate was calculated with the number of somatic nonsynonymous single nucleotide variant (SNV) mutations per megabase [10], and the threshold for high TMB was set as the uppertertile [6].
Reproduction of test with quantitative real-time polymerase chain reaction
To reproduce our test with different platforms of technology, we set up quantitative real-time polymerase chain reaction (qRT-PCR) on a 7900HT Sequence Detection System (Applied Biosystems, Foster City, CA, USA) in 384-well plates using a final volume of 10 µL per reaction consisting of 5 µL 2X Taqman PreAmp Master Mix, 4 µL cDNA sample, and 1 µL primer/probe. PCR amplifications were performed in triplicate wells using the following conditions: 2 minutes at 50°C and 10 minutes at 94°C, followed by 40 two-temperature cycles of 95°C for 15 seconds and 60°C for 60 seconds.
Immunohistochemistry for PD-L1
Immunohistochemistry (IHC) was performed on each representative section ofthe FFPE samples. Staining for PD-L1 was conducted using an FDA-approved monoclonal mouse antibody, PD-L1 22C3 pharmDx (Dako, Carpinteria, CA, USA). PDL1–stained IHC slides were interpreted by an experienced pathologist (K.M.K.): CPS was calculated by summing the number of PD-L1–stained cells (tumor cells, lymphocytes, macrophages) and dividing the result by the total number of viable tumor cells, multiplying by 100 [11], and assessing according to the PD-L1 IHC 22C3 pharmDx instructions for use (https://www.agilent.com/cs/library/ usermanuals/public/29219_pd-l1-ihc-22C3-pharmdx-gastric-interpretation-manual_us.pdf). PD-L1 IHC was interpreted as positive if the score was 1 or more and negative ifthe score was less than 1.
Statistical analyses
Statistical analyses were conducted using R software (https://www.r-project.org/foundation/) version 3.4.4. Pearson correlation coefficient was used to find correlations between IMmunotherapy Against GastrIc Cancer (IMAGiC) groups with Response Evaluation Criteria in Solid Tumors (RECIST) group, PD-L1 CPS, and EBV infection status. To compare the IMAGiC scores with RECIST groups, EBV status, and tumor mutation lead (TML), Wilcoxon test and Kruskal-Wallis test were used. All P-values were two-sided, and P<0.05 was considered significant.
RESULTS
Differentially expressed genes in responses to pembrolizumab
Gene expression profiling from 21 GC tissues were analyzed in relation to responses to pembrolizumab. CR was found in two cases, partial response (PR) in four cases, stable disease (SD) in five cases, and progressive disease (PD) in 10 cases based on the RECIST. These cases were reallocated into two groups based on RECIST: a response group that included the patients with CR and PR and a no-response group that included those with SD and PD.
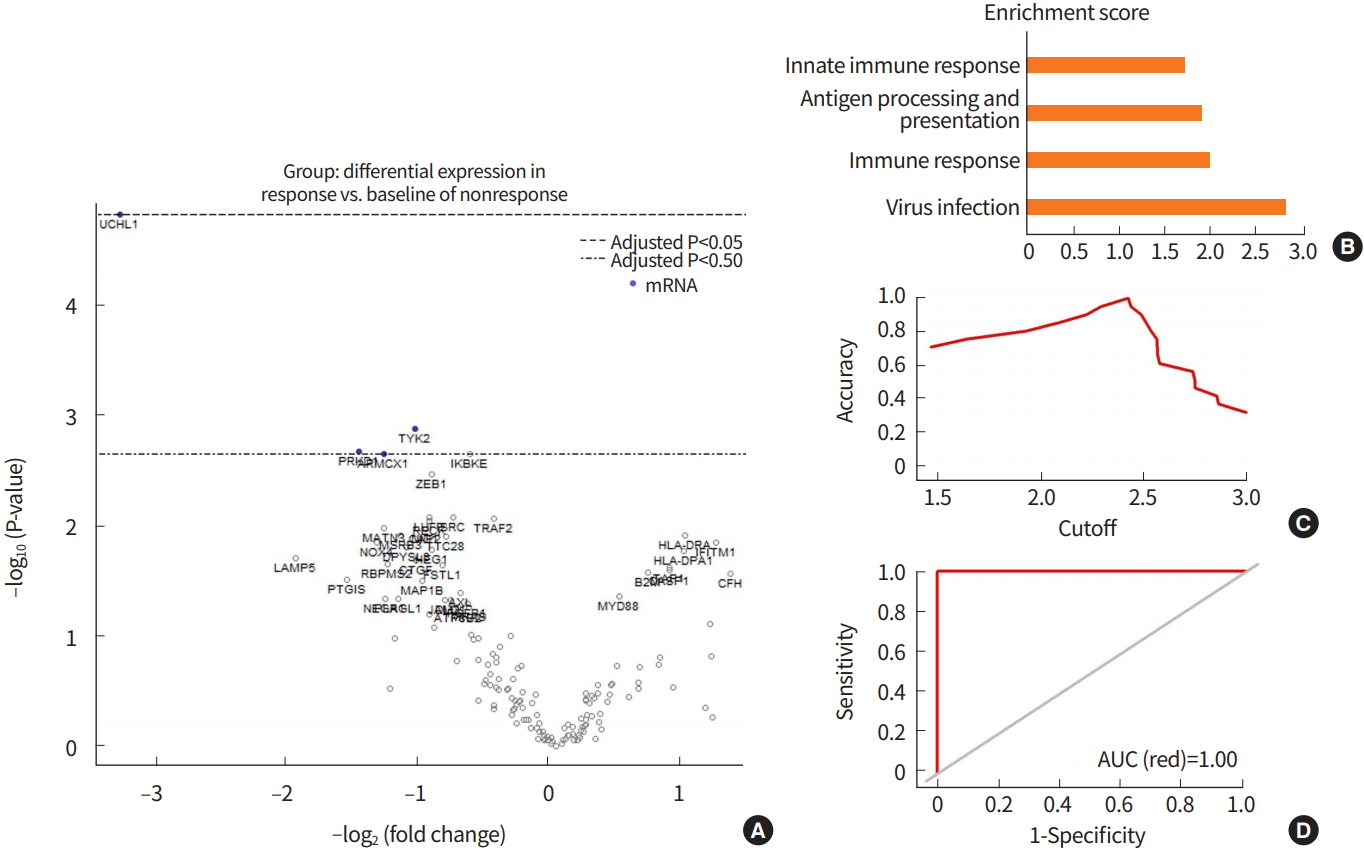
To identify prediction signature genes, DEG analyses were performed using nSolver software (Fig. 1A). Enrichment analysis was performed using all DEGs (P<0.05). All DEGs were most significantly associated with EBV infection and immune responses, including antigen processing and presentation and the innate immune response (Fig. 1B, Supplementary Fig. 2), suggesting that the most important factors in predicting response to pembrolizumab are related to immune reactions. Finally, four genes that were significantly differentially expressed between the response group and the no response group for pembrolizumab therapy were selected in the DEG analysis (P<0.01).
Development of IMAGiC model to predict responses for pembrolizumab
To construct a model to predict responses to pembrolizumab, we used a linear regression analysis using mRNA expression levels of four genes selected from DEG. As PD-L1 expression is also an important biomarker for pembrolizumab responses [3,6,12,13], PD-L1 CPS was also used for IMAGiC. To evaluate the performance of IMAGiC, we verified this model in the same patient cohort. All IMAGiC groups matched perfectly to the responses for pembrolizumab. The sensitivity, specificity, and accuracy of the IMAGiC model were calculated using the AUC method, and all of them were 100% (Fig. 1C, D). To reduce bias of the selected data and improve the performance of the IMAGiC model, we performed 10-fold cross-validation. All 21 samples were used to construct the IMAGiC model and were divided into 10 groups for each cross-validation step; nine of the 10 groups were used for testing and the remaining group was used for validation. The mean RMSE was 1.751.
The IMAGiC group was developed based on the IMAGiC score and RECIST groups for pembrolizumab, and the cutoff value of IMAGiC score was set as 2.5069 using the accuracy function in the AUC package. Finally, mGC patients were divided into two groups based on IMAGiC: to be responder and to be non-responder. The IMAGiC groups correlated well with RECIST group (r2=0.83), PD-L1 CPS (r2=0.64), and EBV infection status (r2=0.56). The IMAGiC score was significantly associated with RECIST groups (P=0.0057), EBV status (P=0.048), and TML (P=0.023) (Fig. 2).
Analyses of IMAGiC in TCGA and ACRG cohorts
As PD-1 blockades have been shown to be effective for MSI [6,14] and EBV-positive tumors [15-17] as well for tumors with high TMB [18,19], we applied the IMAGiC prediction model for TCGA RNA sequencing data (n=260) [10] and ACRG mRNA expression array results (n=300) [20].
In the TCGA group,there were 59 cases (22.7%) with MSI, 24 (9.2%) with EBV-positive, and 61 (23.5%) with TMB-high subtype GC. The total mutation rates were distinct in four molecular subtypes (Fig. 3A). IMAGiC was significantly associated with TCGA molecular subtype (P=1.21E-04), MSI (P=0.01), EBV (P=0.09), and TMB status (P=1.19E-05) (Table 2). Many patients with MSI- or EBV-positive GC were classified as responders by IMAGiC. The IMAGiC scores in GC associated with MSI and TMB were significantly higher than those in the microsatellite stable (MSS) and no-TMB groups (Fig. 3B, C).
In ACRG, 68 (22.7%) were MSI and 18 (6.0%) were EBV-positive subtypes (Table 3). We found that IMAGiC groups were associated with recurrence-free survival, ACRG molecular subtype (P=1.96E-08), and MSI (P=0.006) (Fig. 4).
Reproduction and validation of IMAGiC with qRT-PCR To assess the reproducibility ofthe IMAGiC model with different technology platforms for use in clinical practice, we developed qRT-PCR using mRNA from 24 patients from the same cohort. The IMAGiC groups by qRT-PCR also highly correlated with the RECIST group (r2=0.82), EBV (r2=0.48), and MSI (r2=0.66) (Supplementary Fig. 3). The precision of reproduction of IMAGiC was 87.5% (positive predictive value, 87.5%; negative predictive value, 12.5%).
To validate IMAGiC qRT-PCR in other patients with mGC, we used 17 samples from the ongoing trial with nivolumab (Opdivo, Bristol-Myers Squibb Company Inc., New York, NY, USA). All cases were EBV-negative, and most of them (94.1%) were MSS and PD-L1 CPS negative (Table 4). Like recent clinical trials and studies in which MSI, EBV-positivity, and positive PDL1 CPS were associated with response to pembrolizumab [6], most of the cases were classified into non-responder based on RECIST group. To investigate whether the IMAGiC qRT-PCR model was as accurate as the original, we calculated IMAGiC scores using this nivolumab cohort and the precision was 100% (positive predictive value, 100%; negative predictive value, 0%) although the number of cases was small.
DISCUSSION
Identifying accurate biomarkers predicting response to immunotherapy is crucial for precision oncology. Here, we developed an IMAGiC modelthat highly correlated with RECIST, MSI, TMB, and molecular subtype of GC. To easily apply this prediction model in the clinic, a qRT-PCR-based IMAGiC model was developed and reproduced these results.
Molecular characterization study showed that approximately 34% ofGCs exhibit a relatively high TMB including, but not limited to, tumors with MSI [10]. In addition to GC with EBV-associated and MSI,tumors with high TMB also responded well to pembrolizumab, a selective humanized monoclonal antibody designed to bind to PD-1 that blocks the interaction between PD-1 and its ligands such as PD-L1 [21]. However, the high numbers of non-responders and the emergence of resistance in patients who do initially respond are significant challenges in the field of cancer immunotherapy [5]. A recent molecular characterization study of patients with mGC treated with pembrolizumab showed that MSI, EBV, PD-L1 CPS, and TMB were associated with responses [6]. In addition, in a cohort of patients with mGC treated with nivolumab, a fully human immunoglobulin G4 (IgG4) monoclonal antibody against PD-1, responses were observed in patients with at least one of the following factors: presence of the dMMR biomarker, high TMB, EBV-positive status, and PD-L1-positive status in tumor cells. Given that elevated PD-L1 expression is frequently observed in GC with an elevated host immune response, tumors with MSI/EBV-associated/high TMB are associated with a favorable prognosis [22,23] and predictresponses to pembrolizumab in GC [6]. To prove this, we built a predictor of responses to pembrolizumab after analyzing the mRNA expression and PD-L1 CPS data of 25 patients. We focused on four genes related to immune and mesenchymal transformation using machine learning technology. Based on these findings, the prediction scores were calculated, with lower scores predicting higher chances of responses. Reassuringly, by examining an additional 17 tumor samples from patients treated with nivolumab, we found that IMAGiC again predicted the responses of patients to treatment. Additionally, we found that IMAGiC was significantly associated with recurrence-free survival in ACRG datasets.
Pembrolizumab is one of the well-known targeted ICB agents for patients with various cancers with overexpression of PD-L1 [2,4,12,24]. Unfortunately, not all patients show a response to pembrolizumab; it is not always successful for patients whose tumors overexpress PD-L1. Moreover, anti-PD-1/PD-L1 antibodies have anecdotally been reported to cause rapid progression of some types of cancers, although the incidence in GC remain unclear [25]. The high populations of non-responders and emergence of hyperprogressive disease pose significant challenges in the field of cancer immunotherapy [26].
Although PD-L1 is obviously an important predictive biomarker for response to immune checkpoint inhibition in GC, MSI, dMMR, and high TMB have demonstrated potential roles as positive predictive biomarkers [6,27]. In the present study, we combined PD-L1 CPS and signature gene set data and developed an IMAGiC modelto predictresponse to pembrolizumab in patients with mGC, and those results were validated in patients with mGC treated with nivolumab. Four genes showed significantly different expression levels between the response group and non-response group (P<0.01) and are involved in cell proliferation, innate immune response, protein phosphorylation, and tumor suppression. As the genes comprising IMAGiC were significantly related to immune responses, we could find that the IMAGiC groups correlated well with PD-L1 CPS and EBV infection. In our cohort, all but two patients with MSI GC and all EBV-positive GC were in the responder group, and IMAGiC predicted them to be non-responders.
Given the low response rate, appropriate patients should be selected prior to PD-1/PD-L1 inhibitor therapy. Identifying predictive biomarkers to identify patients most likely to respond to ICB would decrease treatment costs and the likelihood of immune-related adverse events [28]. For our group of pembrolizumab-treated patients, we developed a novel prediction model via machine learning methods based on RECIST response groups, IMAGiC, which is significantly associated with EBV and TMB. PD-L1 expression is generally believed to be a surrogate of pre-existing immune-specific activity and can be upregulated by interferon-γ in the tumor microenvironment [29]. However, responses to immune checkpoint inhibition in GC are also related to MSI, EBV, and TMB. With the increased understanding of tumor immune escape, establishing a wide-ranging framework of multiple biomarkers is necessary for patient selection and precision medicine [28].
Although this study confirmed value in predicting response to immune checkpointinhibitors,the population was small in the discovery cohort (n=21) and validation cohort (n=17). So, further prospective validation is recommended in other cohorts. Moreover, as GC is among the most immunogenic tumors after melanoma, bladder, and lung cancer [30], we are planning to apply IMAGiC model to those immunogenic cancers in ongoing immunotherapy trials.
In conclusion, we developed a combined biomarker, IMAGiC, for predicting responses to pembrolizumab using mRNA levels and PD-L1 CPS. IMAGiC correlated well with EBV, TMB, and MSI and was further validated in other cohorts.