Analysis of microRNA expression in glial tumors by using a peptide nucleic acid-based microarray
Article information
Abstract
Purpose
Glial tumors are the most common primary brain tumors. However, their characteristics and prognosis are difficult to discern. There is currently an emphasis on microRNAs (miRNA) as candidate biomarkers for glial tumors. The aim of this study is to identify the specific miRNA patterns in glial tumors by using peptide nucleic acid (PNA)- based microarrays in an assortment of glial tumors and normal tissue samples.
Methods
Sample files were retrospectively assessed for cases diagnosed as glial tumors at the pathological archives of two institutes. miRNAs of 28 cases of glial tumors were analyzed by microarray. In order to verify the results, quantitative real-time polymerase chain reaction (RT-PCR) was performed. miRNA expression was calculated using the 2-ΔΔCT method. The expression level of the miRNAs was compared using SPSS version 20.0 (IBM Co.).
Results
miRNA expression profiling of glial tumors revealed that 62 miRNAs were detected from glioblastoma and benign brain tissue, with different expression patterns. The expression of miR-296-3p, miR-370, and miR-371-5p was shown to be involved in malignancy. These miRNAs were also increased in the glioblastoma with methylated O6-methyguanine DNA methyltransferase. The expression pattern of miR-296-3p shows same tendency in PNA-based microarray and RT-PCR.
Conclusion
These analyses suggest that novel miRNAs can be applicable as diagnostic tools and target therapeutic agents, since miRNAs can positively or negatively regulate glioblastomas.
INTRODUCTION
Glial tumors are the most common primary brain tumors. They demonstrate diverse histological features, distribution in the brain, clinical course and prognosis. Because of this variation and rare occurrence, the characterization and prognosis of glial tumors are poorly understood [1].
MicroRNAs (miRNAs) are short single stranded-ribonucleic acids, approximately 21 nucleotides long. They are post-transcriptional regulators that endogenously express non-coding RNAs. miRNAs function to regulate translation of target mRNAs and transcription of target genes. miRNA genes are initially transcribed by RNA polymerase II and subsequently processed into primary miRNA (pri-miRNA). pri-miRNA is cleaved by the nuclear ribonuclease III enzyme, Drosha and the double-stranded RNA-binding domain protein, Pasha to become pre-miRNA. pre-miRNA is then translocated to the cytoplasm via the nuclear export factor, exportin 5. A second cleavage takes place in the cytoplasm by Dicer, the RNAase enzyme III and loquacious, a double-stranded RNA-binding domain protein. After cleavage, the guide strand is incorporated into the RNA-induced silencing complex and to represses the target RNA [2,3].
The role of miRNAs has been studied extensively, and they have been shown to regulate cell proliferation, differentiation, and apoptotic cell death by regulating oncogenes or tumor suppressor genes [4]. For example, miR-155 and miR-17- 92 cluster of miRNAs were the first miRNAs found to be overexpressed in cancer, specifically in B-cell lymphomas [5].
Gliomas are the most common and most deadly malignant primary brain tumors. And they are categorized according to the World Health Organization (WHO) as WHO Grades I to IV. This tumor classification system was revised in 2007, based on histological characteristics, which carry prognostic and survival correlates [6]. Glioblastoma, defined as a WHO Grade IV glioma, demonstrates rapid proliferation, angiogenesis, hypoxia, necrosis, heterogeneity, and stem cell-like behavior [7]. In addition, glioblastoma cells are known to infiltrate normal brain tissue, which makes it difficult to complete surgical resection. Moreover, they are relatively chemoresistant and radioresistant [8].
Several studies have demonstrated altered miRNA expression in glioblastoma. They reveal that the expression level of miRNAs is one of the key features of the pathogenesis of glial tumors. miRNAs have been identified as candidate biomarkers as diagnostic tool and potential therapeutic agents for glial tumors. In this study, we aimed to identify the specific miRNA patterns in glial tumors using peptide nucleic acid (PNA)-based microarray in a collection of glial tumors and normal tissue samples.
METHODS
Study samples
The study set includes samples identified by a retrospective search for cases diagnosed as a glial tumor between 2007 and 2014 at the Archives of Pathologic Department at Dong-A University Hospital and Samsung Changwon Hospital. A total of 28 cases were selected. Studies were carried out in full ethics committee approval by Institutional Review Board of Dong-A University Hospital (IRB No. 12-070) and Samsung Changwon Hospital (IRB No. 2011-SCMC-106-00). The study was conducted according to guidelines of the Declaration of Helsinki for biomedical research. Informed consent was waived due to its retrospective nature and the minimal risk of harm to the patients. Samples were excluded, if the storage condition of formalin-fixed paraffin-embedded (FFPE) sample was inappropriate, the proportion of tumor tissue to total tissue was less than 20%, or the fraction or concentration of RNA isolated from FFPE samples was not satisfactory.
RNA isolation
RNA isolation was performed using the PureLink FFPE total RNA isolation Kit (Invitrogen, Waltham, MA, USA) following the manufacturer’s protocol.
Deparaffinization
Melting buffer (300 μL) was added to three to eight pieces of FFPE samples 10 μm section in diameter. The samples were then centrifuged at maximum speed. And incubated for 10 minutes at 72℃ in order to melt the paraffin. Samples were mixed by tapping. Proteinase K (20 µL) was then added and samples were incubated at 60℃ for 10 to 60 minutes in order to lysis. After centrifugation, the thin paraffin layer was separated from the lysate and transferred to a clean RNase-free tube.
Purification
Binding buffer and 100% ethanol were added to the samples followed by centrifugation. The flow through was discarded and 100% ethanol and wash buffer were added. The cartridge was centrifuged and then placed into a clean recovery tube. Heated RNase-free water was added to the center of the cartridge, and the cartridge was then incubated and centrifuged. Total RNA then collected and stored on the ice or at –80℃.
miRNA arrays
miRNA profiling was performed using a training set. Highly purified total RNA was measured using a NanoDrop Spectrophotometer (Thermo Scientific, Waltham, MA, USA). In total 400 ng of RNA from each sample was used. miRNA labeling and analysis were performed using a PANArray miRNA expression profiling kit (PANAGENE Inc., Daejeon, Korea) according to the manufacturer’s instructions. The PANArray miRNA expression profiling kit is a PNA-based microarray. Overexpressed miRNA was defined as exhibiting a ratio of miRNA expression level in glial tumors to the control group of 1.3 or more and underexpressed miRNA was defined as having a ratio of 0.7 or less.
Validation of miRNA expression by real-time polymerase chain reaction
Real-time polymerase chain reaction (RT-PCR) was performed for verification of the miRNA microarray results using total sample, including a training set and a validation set. Total RNA was reverse-transcribed into cDNA using a TaqMan miRNA reverse transcription kit according to the manufacturer’s protocol. miRNA expression was calculated by using the 2-ΔΔCT method.
The threshold cycle (CT) indicates the fractional cycle number at which the amount of amplified target reached a fixed threshold [9]. The CT value of each sample was calculated. ΔCT value was determined by subtracting CT value of the internal control, RNU6B, from the CT value of the miRNA in each group. All ΔCT values were averaged. The ΔΔCT value was found by subtracting the ΔCT value of each control sample, normal patient’s data, from the ΔCT of each sample and 2-ΔΔCT was then calculated. The microarray ratio was compared with the 2-ΔΔCT value for each miRNA.
Statistical analysis
miRNA expression levels were compared using the Kruskal-Wallis test and the Mann-Whitney U-test using the SPSS software version 20.0 (IBM Co., Armonk, NY, USA). Differences between other factors were analyzed with Student’s t-test for normally distributed continuous values and Mann-Whitney U-test for non-normally distributed continuous values. Chisquare test was used to analyze categorical variables. The survival status was checked, and date of death was confirmed and recorded when the patient succumbed. Two-sided P-values < 0.05 were considered statistically significant.
RESULTS
Patient characteristics
In order to assess the expression profile of miRNA in glioma, the expression of 63 miRNAs were analyzed using a PNA-based microarray. All the patients who were alive were followed up for 5 years or more, and mean duration of follow-up was 8.3 years. The age of the patients ranged from 7 months to 71 years (mean age, 41 years). Four cases were diagnosed with WHO Grade I (14.3%; mean age, 12.9 years), three cases were diagnosed with WHO Grade II (10.7%; mean age, 34.3 years), five cases were diagnosed with WHO Grade III (17.9%; mean age, 44.4%), and 16 cases were diagnosed with WHO Grade IV (57.1%; mean age, 48.3 years) (Table 1). The mean age of patients increased according to WHO Grade.
In Grade IV patients, O6-methylguanine DNA methyltransferase (MGMT) methylation was positive in 11 cases (0.69%), whereas five cases (0.45%) in this group were negative for MGMT methylation. Thirteen cases were males (mean age, 47.8 years), and 15 cases were females (mean age, 35.1 years).
miRNA expression analysis
miRNA expression analysis based on the WHO grading system
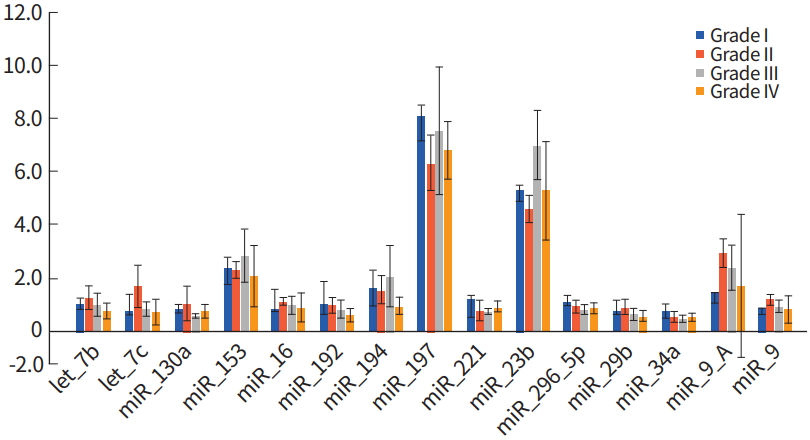
In total 63 miRNAs were compared between glioma tumor and the normal samples, and significantly altered miRNAs were selected based on a P-value of < 0.05 using the Kruskal-Wallis test. The miRNA expression profile in each grade of glioma showed that gliomas could not be distinguished according to malignancy (Fig. 1). There were no significant trends or differences in miRNA expression levels among WHO Grade I to WHO Grade IV samples, based on increasing malignancy.
Analysis of miRNA expression in epigenetic low-grade and epigenetic high-grade tumors
WHO Grade I (pilocytic astrocytoma) and WHO Grade II (low-grade astrocytoma) gliomas are categorized as epigenetic low-grade gliomas. However, Grade III (anaplastic astrocytoma) and Grade IV (glioblastoma multiforme) are categorized as epigenetic high-grade gliomas [10]. miRNA expression in epigenetic low-grade gliomas versus epigenetic high-grade gliomas was compared using the Mann-Whitney U-test. miR200c, miR-296-3p, miR-370, and miR-371-5p were increased in epigenetic high-grade gliomas compared to epigenetic low-grade gliomas (P< 0.48, P< 0.21, and P< 0.24, respectively) (Table 2, Fig. 2).
Analysis of miRNA expression in WHO Grade I, II, III and Grade IV gliomas
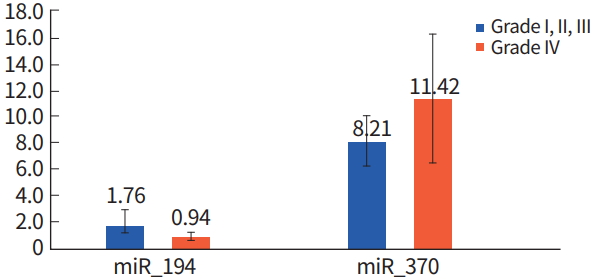
The miRNA expression level in samples designated as Grade I, II, and III were compared to Grade IV samples, which are termed glioblastoma, and has the greatest malignancy. Compared to WHO Grade I to III gliomas, miR-194 was decreased in glioblastoma, whereas, miR-370 was increased as determined using by using Mann-Whitney U-test (P< 0.00 and P< 0.019, respectively) (Table 2, Fig. 3).
Analysis of miRNA expression in WHO Grades II, III and Grade IV gliomas
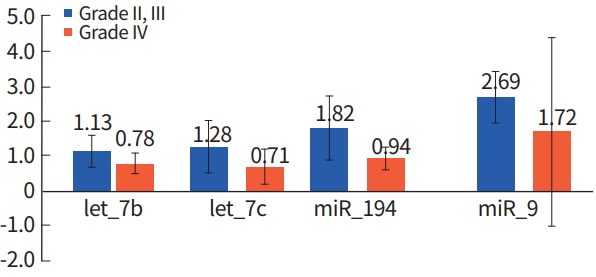
Grade I glioma has benign characteristics. Therefore, Grade II and Grade III gliomas were categorized as one group and compared to Grade IV glioblastoma. There was no increase in miRNA expression in glioblastoma; however, let-7c, miR-194, and miR-9 were decreased in glioblastoma compared to Grade II and III samples, as determined using the Kruskal-Wallis test (P< 0.000) (Table 2, Fig. 4).
miRNA expression analysis according to MGMT methylation status in glioblastoma
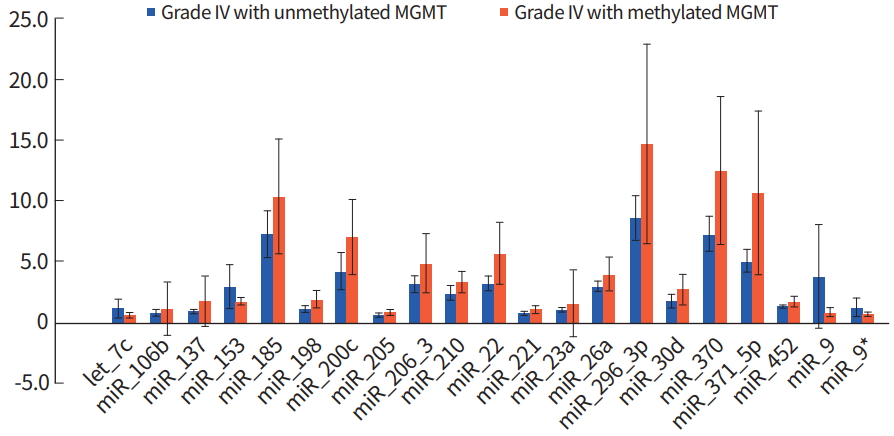
Patients diagnosed with WHO Grade IV glioblastoma were divided into two groups according to methylation of the MGMT promoter. The differences in miRNA expression levels between the two groups were analyzed using the Mann-Whitney U-test. The expression levels of miR-296-3p, miR-370, and miR-371-5p increased when MGMT promoter was methylated (P < 0.00). However, miR-9 expression levels increased when MGMT promoter was unmethylated (P< 0.009) (Table 2, Fig. 5).
Verification of PNA-based microarray miRNA expression patterns by TaqMan RT-PCR
miRNA expression patterns from PNA-based microarray were confirmed by TaqMan quantitative PCR (qRT-PCR). In particular, miR-296-3p and miR-370 were increased in epigenetic high-grade glioma (Grade III and IV gliomas) and MGMT-methylated glioblastoma. The comparison between miRNA data from the PNA-based microarray and miRNA levels from TaqMan RT-PCR showed that miR-296-3p expression was shown to be increased by qRT-PCR, but miR-370 expression was decreased as determined by TaqMan qRT-PCR (Fig. 6).
DISCUSSION
Glial tumors are the most common primary brain tumors. There were 10,004 newly diagnosed brain tumors from a population of 49.9 million in 2013 in the Republic of Korea, of which, 1,873 cases (18.7%) were gliomas. Glioblastoma represents 5.2% of all tumors and 34.4% of gliomas. The overall crude rate of brain tumors in the Republic of Korea in 2013 was 20.06 per 100,000 individuals [11].
In 2005, Lu et al. [12] reported that using miRNA expression profiles for the classification of malignant tumors was more precise than using their mRNA profiles. miRNA research has since then assisted the field of oncology. Many studies were conducted to investigate miRNA expression levels, their cellular function, and usefulness as diagnostic or prognostic markers in glial tumors.
Increased expression of miR-10b was observed in glioblastoma, so it was speculated that this miRNA could promote invasion. miR-21 was known for its anti-apoptotic function via the suppression of tumor suppressors. miR-221 was found to be increased in invasive high-grade gliomas, and miR-124 and miR-137 can inhibit proliferation by inducing cell cycle arrest through inhibition of cyclin dependent kinase 6 (CDK6) [4].
In this study, PNA-based microarray was used to detect miRNA expression in glial tumors. Because it is uncharged, PNA has strong binding affinity with RNA rather than DNA. PNA-based microarray analysis is a highly sensitive and specific tool for detection of target miRNAs [13]. A quantitative RT-PCR was performed to verify the microarray data.
In summaries, total 63 miRNAs were compared and miRNAs that were statistically different between normal and tumor samples based on a P-value of < 0.05 were selected. The miRNA expression ratio was calculated, and overexpressed miRNA was identified when the ratio of miRNA expression in glial tumors to the control group was 1.3 or more and underexpressed miRNA was identified when the ratio was 0.7 or less.
miRNA expression analysis according to WHO Grade system
There were no significant trends in miRNA expression based on the WHO grading system. Additional studies should therefore be done to find miRNAs that proportionally relate to malignancies.
miRNA expression analysis according to low-grade and high-grade gliomas
In presenting study, four patients diagnosed with pilocytic astrocytoma (WHO Grade I) and three patients with low-grade astrocytoma (WHO Grade II) were grouped as epigenetic low-grade gliomas. Five patients confirmed as having anaplastic astrocytoma (WHO Grade III) and 16 patients diagnosed with glioblastoma (WHO Grade IV) were categorized as epigenetic high-grade gliomas.
The let(lethal)-7c and miR-194 expression increased in epigenetic low-grade glioma, compared to the epigenetic high-grade glioma group. The miR-200c, miR-296-3p, miR-370, and miR-371-5p were also increased in epigenetic low-grade gliomas. Particularly, miR-371-5p had a higher miRNA expression ratio of 1.47 than other miRNAs. The let-7 family members were one of the first identified miRNAs. They have been identified as tumor suppressors in various cancer cells. There are some studies concerning the anti-tumorigenic effect of let-7 miRNA, especially in glioblastoma [14,15]. The miR-194 is known to be decreased in oral and colon cancer but increased in prostate cancer. Following interferon β (IFN-β) treatment of the human glioma cell lines, miR-194 increased by over 2 folds [16]. The miR-200c is a miRNA-200 family member that is known to be correlated with poor prognosis [17]. The miR-296 is known to have an angiogenic effect that promotes human microvascular endothelial cell migration to the brain. However, its expression level is increased in glioblastoma, and it is overexpressed in tumor associated endothelial cells in glioma via downregulation of the hepatocyte growth factor-regulated tyrosine kinase substrate [18,19].
miRNA expression analysis according to WHO Grade I to IV
The miRNA expression levels were compared between WHO Grade I to III gliomas and WHO Grade IV glioblastoma which shows greatest malignancy (Fig. 3). The miR-194 expression was decreased in glioblastoma. In contrast, miR-370 was increased, as determined using the Mann-Whitney U-test (P< 0.00 and P< 0.019, respectively).
Previous studies have assessed miRNA expression in glioblastoma and anaplastic astrocytoma, miR-16, miR-21, miR-22, miR-24, miR-34a, miR-126, miR-142-5p, miR-143, miR146b-5p, miR-155, and another 10 miRNAs were upregulated in glioblastoma. However, miR-128-1, miR-128-2, miR-219-2- 3p were downregulated. In another study, which compared glioblastoma and diffuse astrocytoma, and anaplastic astrocytoma, miR-9, miR-15a, miR-16, miR-17, miR-19a, miR-20a, miR-21, miR-25, miR-28, miR-130b, miR-140, and miR-210 were found to be overexpressed in glioblastoma. Other studies compared glioblastoma with normal brain and observed that miR-9, miR-10b, miR-21, miR-25, miR-123, and miR-221 were increased in glioblastoma. However, miR-128-1, miR-181a, miR-181b, miR-181c were decreased in glioblastoma [20].
miRNA expression analysis according to WHO Grade II, III and Grade IV
WHO Grade I glioma has a benign nature. Therefore, miRNA expression levels were analyzed with the exception of Grade I gliomas, in order to identify miRNA related to malignant potential. Grade II and Grade III gliomas were categorized and compared to Grade IV gliomas.
The expression of let-7b, let-7c, miR-194, and miR-9 were relatively decreased in glioblastoma. Moreover, miR-9 was overexpressed in glioblastoma stem cells, which is in contrast to miR-9 showed a previous study. miR-9 inhibits calmodulin-binding transcription activator 1 which functions as a tumor suppressor by reducing neurosphere formation and tumor growth [10]. There are a few studies about miR-194 expression and function in glioma. miR-194 expression increased with IFN-β treatment, resulting in reduced tumor progression [21]. Other studies comparing WHO Grade II gliomas with WHO Grade III gliomas and WHO Grade IV gliomas have suggested nine miRNAs related to tumor aggressiveness. Furthermore, miR-155, miR-21, miR-210, and miR-22 are thought to be involved in tumor growth and invasion [22].
The expression of miR-370 was increased in the glioblastoma as well as high-grade glioma in the presenting study, which was suggestive for the several roles in the malignant gliomas. On the contrary, increased expression of miR-370 should inhibit cell proliferation and cell cycle arrest, as well as increased apoptosis in esophageal squamous-cell carcinoma cells via upregulating peptidyl-prolyl cis/trans isomerase [23]. Additionally, there is a report that the miRNA-370 induced growth inhibition and apoptosis of retinal capillary endothelial cell while the inhibition of miRNA-370 reversed these effects [24]. miR-370 also showed upregulated the expression of CyclinD1, p21, p27, FasL, and Bim [24]. These opposite results compared with expression of miR-370 are necessary for further functional study in vitro as well as in vivo.
miRNA expression analysis according to methylation status of the MGMT gene in glioblastoma
It is well known that MGMT promoter methylation is related to characteristics and prognosis of glioblastoma. The MGMT gene encodes a DNA repair protein. Methylation of the CpG islands of the promoter region of the MGMT gene results in epigenetic silencing. The protein products of MGMT genes removes alkyl products from the O6 position on guanine. Loss of gene transcription and protein expression of the MGMT gene by methylation leads to decreased DNA repair and retention of alkyl groups [25]. It is a marker of resistance to chemotherapeutic alkylating agents including temozolomide in glioblastomas [26].
miRNAs from 16 patients diagnosed with WHO Grade IV glioblastoma were analyzed. They were divided into two groups based on MGMT gene methylation status. Eleven patients had MGMT gene methylation, and five patients had an unmethylated MGMT gene. The expression of let-7c, miR-153, miR-9, and miR-9* were decreased in MGMT methylated glioblastoma. A total of 17 miRNA demonstrated increased expression in MGMT methylated glioblastoma. Particularly, the expression of miR-137 and miR-371-5p increased with more than 2.0 expression ratios, 2.04 and 2.11, respectively. miR137 inhibits proliferation of glioblastoma cells and induces differentiation of brain tumor cells. Previous studies have shown that it demonstrates low expression levels in anaplastic astrocytoma and glioblastoma [27,28].
Verification of PNA-based microarray miRNA expression patterns using TaqMan RT-PCR
Several miRNAs were selected, and their expression patterns determined from PNA-based microarray were confirmed using TaqMan qRT-PCR. Particularly, miR-296-3p and miR-370 expression increased in WHO Grade III glioma and MGMT methylated glioblastoma. miR-296-3p expression also increased as determined by qRT-PCR. However, miR-370 showed conflicting results between the two methods. miR-370 was increased in the microarray but was repressed based on TaqMan RT-PCR. Therefore, additional studies are needed to validate miRNAs that show significant results with TaqMan RT-PCR.
Limitations of the study
Although our study suggests a meaningful role of the several miRNA scale in predicting the prognosis and diagnosing glial tumors, we note several important limitations. First, the retrospective nature of the analysis in the present study is inborn limitation which cannot be overcome. We attempted to partially mitigate this bias by extracting the patient data from complete medical and radiological records and by including patients who were treated with a similar treatment protocol such as surgical resection followed by adjuvant chemotherapy and/or radiotherapy or not. Despite these efforts, however, the conclusions drawn from our study need further validation through prospective and randomized clinical trials at the multiple institutes. Second, the validation for correcting the inter-observer disagreement was not sufficient. The pathological diagnosis by the review of the pathologic slide was performed by two pathologists (D.C. Kim and Kim M.S.), which could reduce the risk of the misdiagnosis. If there was a discrepancy between the reviewers, they discussed the cause and determined the optimal decision. Third, the histopathologic grade was determined according to the old classification such as 2007 WHO Classification of central nervous system (CNS) tumours in presenting study. In fact, the new WHO classification of the CNS tumors was established in 2016 and this new version included the molecular profiles for diagnosis of the CNS tumors such as isodehydrogense (IDH) mutation and 1p19q codeletion [29]. However, the molecular and genetic analysis were not performed, which could make our result be less informative. Additionally, the much small number of patients and the data from two institutes could be thought to be insufficient to have a strong statistical power. Fourth, we included the only 63 miRNAs in the PNA-based microarray for the gliomas. Unfortunately, our miRNAs were small part of the whole miRNAs and have been not comprehensively reported in the analysis of the gliomas. As there are so many reports dealing the miRNAs which can play a role in the glioma biology (Table 3) [30], it was impossible for our results to be validated by the previously reported data in the gliomas.
In conclusion, our presenting study suggests that several miRNAs should be considered as novel diagnostic and prognostic markers for glial tumors. In the comparison of WHO Grade II and III gliomas to WHO Grade IV glioblastoma, miR194 was decreased in glioblastoma and miR-137 and miR371-5p significantly correlated with MGMT methylation status, in the same tumor type. Moreover, miR-9 was decreased in MGMT methylated glioblastoma.
Notes
No potential conflict of interest relevant to this article was reported.
Acknowledgements
This study was supported financially by the research fund of Samsung Biomedical Research Institute (SBRI), and the authors have no other financial conflicts of interest.
We thank the following individuals: Ki Uk Kim, M.D., Young Jin Song, M.D., and Kyung Su Sung, M.D. (Department of Neurosurgery, Dong-A University Hospital) for the effort to manage the patients; Sunseob Choi, M.D. (Department of Radiology, Dong-A University Hospital), Young Min Kim, M.D., and Mi-Ok Sunwoo, M.D. (Department of Radiology, Samsung Changwon Hospital) for their review of the neuroradiological images; Mee-Seon Kim, M.D. (Department of Pathology, Samsung Changwon Hospital) for her pathological review; and Yongmin Choi, M.D. (Department of Radiation Oncology, Dong-A University Hospital) and Tae Gyu Kim, M.D. (Department of Radiation Oncology, Samsung Changwon Hospital) for administering the radiotherapy; and Young Wook Kim, M.D. (Department of Biostatistics, Samsung Changwon Hospital) for assistance with the statistical analysis detailed in this work.


