Finding the optimal cutoff value for amyloid β positivity using the iterative outlier method and concordance rate
Article information

Abstract
Purpose
The purpose of this study was to calculate the cutoff value for amyloid β (Aβ) positron emission tomography (PET) positivity using the iterative outlier method and to evaluate its validity based on the concordance rate.
Methods
We performed the iterative outlier method on 373 cognitively unimpaired (CU) subjects and calculated the optimal cutoff value for Aβ positivity. The validation was performed using the independent dataset, comprising 83 subjects (27 CU, 27 amnestic mild cognitive impairment, and 29 Alzheimer’s dementia). We evaluated the validity of the Aβ cutoff value by calculating its concordance rate with the visual assessment and between two different Aβ tracers performed in the same subject.
Results
The concordance rate of Aβ cutoff values with the visual assessment ranged from 84.3% to 91.5%, depending on the reference regions. The concordance rate of the cutoff values between the two Aβ tracers ranged from 90.3% to 97.5%, all of which were higher than that of the visual assessment (86.7%).
Conclusion
We demonstrated that the iterative outlier method could identify the cutoff value for Aβ PET positivity.
INTRODUCTION
Alzheimer’s disease (AD) is the most common cause of dementia in the elderly [1], and is characterized by the deposition of amyloid β (Aβ) in the brain. The amyloid cascade hypothesis, a well-known hypothetical model of AD, posits that accumulation of Aβ is the earliest pathogenic process leading to tau deposition, neurodegeneration, and clinical cognitive impairment [2]. Therefore, distinguishing brains free of Aβ from those with Aβ deposition is of utmost importance for the early diagnosis of AD [3].
Previous studies have presented a variety of approaches to define Aβ-positive cutoffs, including the iterative outlier method [7]. Until now, the validity of these cutoffs has often been evaluated with the standard-of-truth (SOT) based on either histological findings of brain autopsy or visual assessment of PET images. However, visual assessment is operator-dependent [8] and it is difficult to obtain postmortem data.
In this study, we calculated the cutoff value for Aβ positivity using the iterative outlier method and evaluated its validity based on the concordance rate. Two tracers were used to evaluate the concordance rate of Aβ positivity based on the cutoff value in the same subject.
METHODS
Development dataset
For the iterative outlier method, we used Aβ PET data obtained from 373 cognitively unimpaired (CU) subjects aged over 50 years. CU subjects were defined as those with normal results on neurological examination and normal cognitive function, expected for their ages and education, on a standardized cognitive test (Seoul Neuropsychological Screening Battery) [9]. Of the 373 subjects, 202 and 171 subjects underwent 18F-florbetaben (FBB) and 18F-flutemetamol (FMM) Aβ PET, respectively.
Validation dataset
For validation of the Aβ-positive cutoff value, we used the head-to-head comparison data, comprising 83 subjects (27 CU, 27 amnestic mild cognitive impairment, and 29 AD), in whom both FBB and FMM Aβ PET were performed. A detailed description is provided in our previous study [10].
Magnetic resonance imaging acquisition
Standardized three-dimensional T1 turbo field echo images were acquired from all subjects at the Samsung Medical Center using the same 3.0-T magnetic resonance imaging (MRI) scanner (Philips Achieva, Philips Healthcare, Andover, MA, USA). The following parameters were used: sagittal slice thickness of 1.0 mm, over contiguous slices with 50% overlap, no gap, repetition time of 9.9 ms, echo time of 4.6 ms, flip angle of 8°, and matrix size of 240 × 240 pixels, reconstructed to 480× 480 over a field of view of 240 mm.
PET acquisition
PET images were acquired using a Discovery STe PET/computed tomography (CT) scanner (GE Medical Systems, Milwaukee, WI, USA) in three-dimensional scanning mode that examined 47 slices of 3.3-mm thickness spanning the entire brain. CT images were acquired using a 16-slice helical CT (140 KeV, 80 mA; 3.75-mm section width) for attenuation correction. According to protocols proposed by the ligand manufacturers, a 20-minute emission PET scan with dynamic mode (consisting of 4× 5 minutes frames) was performed 90 minutes after injection of a mean dose of 311.5 MBq FBB and 185 MBq FMM, respectively. Three-dimensional PET images were reconstructed in a 128× 128× 48 matrix with a voxel size of 2× 2× 3.27 mm using the ordered-subsets expectation maximization algorithm (FBB iterations= 4 and subset= 20; FMM iterations= 4 and subset= 20). Aβ positivity was determined based on visual assessments performed by three experienced raters (two nuclear medicine doctors and one neurologist) [11-15].
Image preprocessing and calculation of the SUVR
To calculate the SUVR, we performed the following processes. First, we co-registered the PET image to the T1-MRI images. Subsequently, we normalized the native PET image to the Montreal Neurological Institute-152 template using the transformation matrix, calculated during the segmentation of T1-MRI. After normalization, the brain was divided into 116 grey matter regions using the automated anatomical labeling (AAL) atlas [16]. We considered three reference regions (whole cerebellum [WC], cerebellar gray matter [CG], and pons) to calculate the SUVR, the regional masks of which were obtained from the GAAIN website (http://www.GAAIN.org) [17]. We calculated the global cortical SUVR as the volume-weighted mean of 56 cortical regions in the AAL template [18]. This pre-processing was performed using SPM8 through Matlab 2014b (Mathworks, Natick, MA, USA).
Iterative outlier method
We used the iterative outlier method and generated an upper- and lower-bound SUVR. During the iteration, subjects with greater than the upper inner-bound (3rd quartile+ 1.5 interquartile range [IQR] or less than the lower inner-bound [1st quartile–1.5 IQR]) values were removed from the dataset. This process was repeated until all outliers were removed. In the final dataset, a cutoff value was determined by adding 2.5% of the maximum SUVR in itself [19].
Statistical analysis
We performed two analyses using the independent dataset to validate the Aβ cutoff value. We first compared the cutoff value-derived Aβ positivity with the visually determined Aβ positivity and calculated the concordance rate. Next, we evaluated whether the cutoff value-derived Aβ positivity of one subject was concordant between the two Aβ tracers (FBB and FMM). We assumed that the optimal cutoff value would distinguish subjects with positive Aβ deposition regardless of the tracer type. The statistical significance of the concordance rate was evaluated using the McNemar’s chi-square test, with a P-value of less than 0.05 indicating non-agreement between the two measures. All statistical analyses were completed using R version 3.5.3 (http://www.r-project.org/). This is a retrospective study using the data from the preceding study [10], which was approved by the Institutional Review Board of Samsung Medical Center (2015-04-091) with written informed consent of the participants at the time of enrollment.
RESULTS
Subject demographics
Table 1 shows the demographics of the development and validation datasets. In the development dataset, subjects who underwent FBB were older than those who underwent FMM. In the validation dataset, although two different Aβ PETs were performed in the same subject, the frequency of A β positivity differed between the two tracers.

Demographics of the development and validation datasets
Aβ cutoff value with the iterative outlier method
Using the iterative outlier method, we calculated the optimal cutoff value for Aβ PET positivity according to the Aβ tracers and reference regions (Fig. 1). In both FBB and FMM, the cutoff value was higher when the CG was used as the reference region.
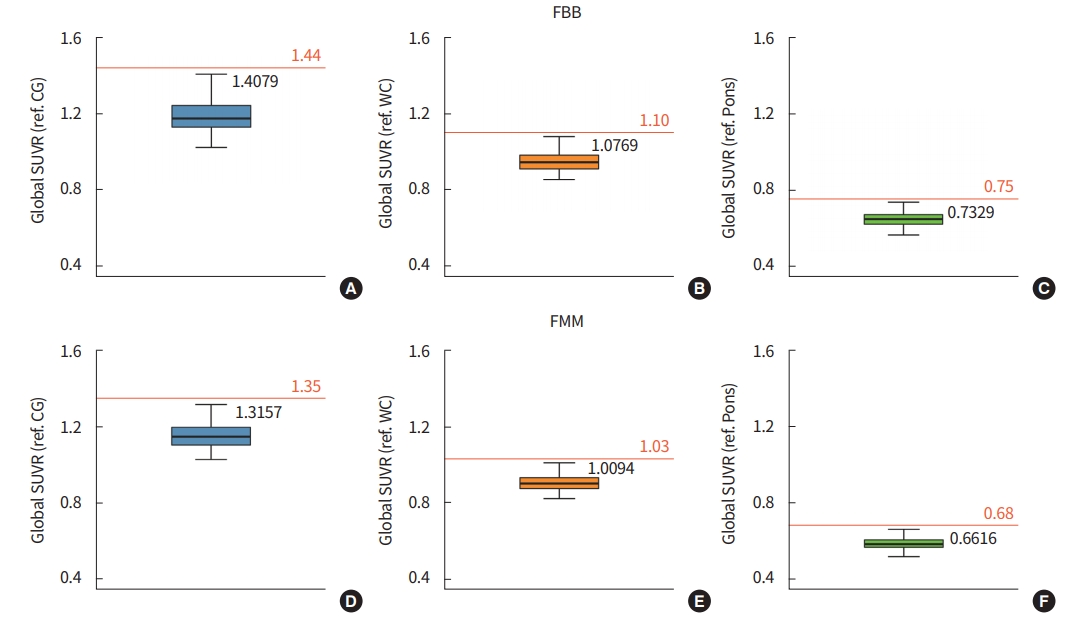
Results of the iterative outlier method for (A, B, C) 18F-florbetaben (FBB) and (D, E, F) 18F-flutemetamol (FMM). Red lines indicate cutoff value derived using the iterative outlier method. SUVR, standard uptake value ratio; CG, cerebellar gray matter; WC, whole cerebellum.
Validation of the cutoff value based on the concordance rate with the visual assessment
To validate the cutoff value derived from the iterative outlier method, we applied the cutoff value for Aβ positivity in the independent dataset and compared it with that of the visual assessment (Table 2). The concordance rate ranged from 84.3% to 91.5%, and the highest rate was observed when the WC was used as the reference for both FBB and FMM. All P-values were greater than 0.05, indicating that the two measures (the cutoff value and the visual assessment) were in accordance.

The concordance rate of the cutoff value with visual assessment
Validation of the cutoff value based on the concordance rate between FBB and FMM
We evaluated whether the cutoff value-derived Aβ positivity was consistent between the two tracers. The concordance rate ranged from 90.3% to 97.5%, all of which were higher than that of the visual assessment (86.7%).
The concordance rate of visual assessment between FBB and FMM was 86.7% (72/83) (Table 3, Fig. 2). There were 11 subjects who showed discordant results (nine subjects [FBB negative/FMM positive] and two subjects [FBB positive/FMM negative]). The concordance rates of the cutoff values were 90.3% (75/83), 97.5% (81/83), and 97.5% (81/83) for each reference region (CG, WC, and pons, respectively) (Table 3). The majority of the subjects who showed discordant results in the visual assessment showed concordant results when the cutoff value was used (9/11 for the CG [Fig. 2A], 11/11 for the WC [Fig. 2B], and 10/11 for the pons [Fig. 2C]).

The concordance rate of the SUVR cutoff between the two Aβ tracers

Scatter plot of 18F-florbetaben (FBB) and 18F-flutemetamol (FMM) standard uptake value ratio (SUVR) with (A) cerebellar gray matter, (B) whole cerebellum, and (C) pons as the reference regions. Dotted lines indicate the cutoff value.
DISCUSSION
In this study, we identified the optimal SUVR cutoff for Aβ positivity using the iterative outlier method and evaluated its validity based on the concordance rate.
We found that the cutoff optimization methods were comparable to visual assessment. Detecting individuals with Aβ deposition is important, as it is valuable for the clinical diagnosis of AD and in clinical trials aiming to reduce the burden of Aβ in the brain [4]. To date, in the clinical field, Aβ positivity of PET is generally determined by experienced clinicians based on visual rating. However, visual rating can be operator- and Aβ tracer-dependent, thus are prone to intra- and inter-rater discrepancies [8]. Interestingly, we found that the iterative outlier method-derived cutoff value had a higher concordance rate of Aβ positivity between the two tracers than that of the visual assessment. Although its superiority to visual assessment should be tested statistically, this finding suggests that the iterative outlier method-derived cutoff value could be an accurate measure of Aβ positivity in FBB and FMM PET.
Although the iterative outlier method may have an advantage over visual assessment, there are other approaches to define Aβ-positive cutoff values, such as receiver operating characteristic (ROC) analyses [20] and clustering methods [21]. The important difference in the approaches is that the iterative outlier method requires an annotated group of cognitively healthy subjects [7], whereas the ROC method requires both diseased and healthy groups [20], and the cluster analysis requires mixed groups that do not require annotations [21].
We further observed that cutoff optimization methods differed according to the reference regions and types of Aβ tracers. This discrepancy precluded the generalization of findings from one Aβ tracer to another [22]. Therefore, studies based on Aβ PET data should describe how the data is processed along with a description of the reference regions and the type of tracer.
The strengths of this study are that we used a data-driven approach to identify cutoff values and used a unique cohort (head-to-head comparison data) for the validation, where two different types of Aβ PET were performed in the same subject. However, this study has several limitations. First, we did not perform a statistical test to compare newly derived cutoff values with results of the visual assessment. This can be done by the bootstrapping method; however, the small sample size of our study precluded this analysis. Second, the iterative outlier method depends on the dataset used. Although we tried to obtain a homogenous dataset by thorough examinations, it is possible that the cutoff value will change if more subjects are included. Therefore, our findings should be interpreted with caution and replicated using a larger dataset. Lastly, ideally, histopathological confirmation of Aβ deposition in the brain should be the SOT. Due to the scarcity of post-mortem data, we considered visual assessment of Aβ PET as the SOT in this study.
In conclusion, we demonstrated that the iterative outlier method could identify the cutoff value for Aβ positivity in both FBB and FMM PET.
Notes
No potential conflict of interest relevant to this article was reported. Sang Won Seo has been editorial board of P&FM since December 2017. He was not involved in the review process of this article.
AUTHOR CONTRIBUTIONS
Conception or design: HRK, YSC, SWS.
Acquisition, analysis, or interpretation of data: HRK, YSC, SHM, HJK, HJ, DLN, SP, SWS.
Drafting the work or revision: HRK, YSC, SWS.
Final approval of the manuscript: HRK, YSC, SWS.